Synthetic example · no customer data
Sales total
Before: three Revenue values. Operation: sum Revenue. After: 400; verify every contributing cell.
120 + 180 + 100 = 400
synthetic-sales.csv · B2 + B3 + B4
CSV ↓ synthetic-sales.csv ArexAi
Real product evidence
This gallery uses the live ArexAi Analyst interface—not a conceptual marketing render. Product claims below are tied to visible flows, current limits and documented privacy boundaries.
Synthetic example · no customer data
CustomerId,Revenue
C001,120
C002,180
C001,100
CustomerId,Segment
C001,Retail
C002,Wholesale
Operation: match CustomerId, approve the relationship, group Revenue by Segment and calculate Sum.
Source check: sales B2 + B4 = 220; B3 = 180. All 3 records match unique customer keys. The report includes cell evidence and a source fingerprint.
Other reproducible checks: Revenue 400; Cost 240; Actual 400 versus Target 390 gives +10; Stock totals 22. Values are unitless synthetic observations, not business performance claims.
Synthetic example · no customer data
Before: three Revenue values. Operation: sum Revenue. After: 400; verify every contributing cell.
120 + 180 + 100 = 400
synthetic-sales.csv · B2 + B3 + B4
CSV ↓ synthetic-sales.csvSynthetic example · no customer data
Before: three item quantities. Operation: sum Stock and review the smallest quantity. After: 22 in total; P002 has 3. No reorder is made.
8 + 3 + 11 = 22
synthetic-inventory.csv · B2 + B3 + B4
CSV ↓ synthetic-inventory.csvSynthetic example · no customer data
Before: Actual and Target for three periods. Operation: compare totals. After: absolute variance +10. This does not imply a forecast.
400 − 390 = +10
synthetic-budget.csv · SUM(B2:B4) − SUM(C2:C4)
CSV ↓ synthetic-budget.csv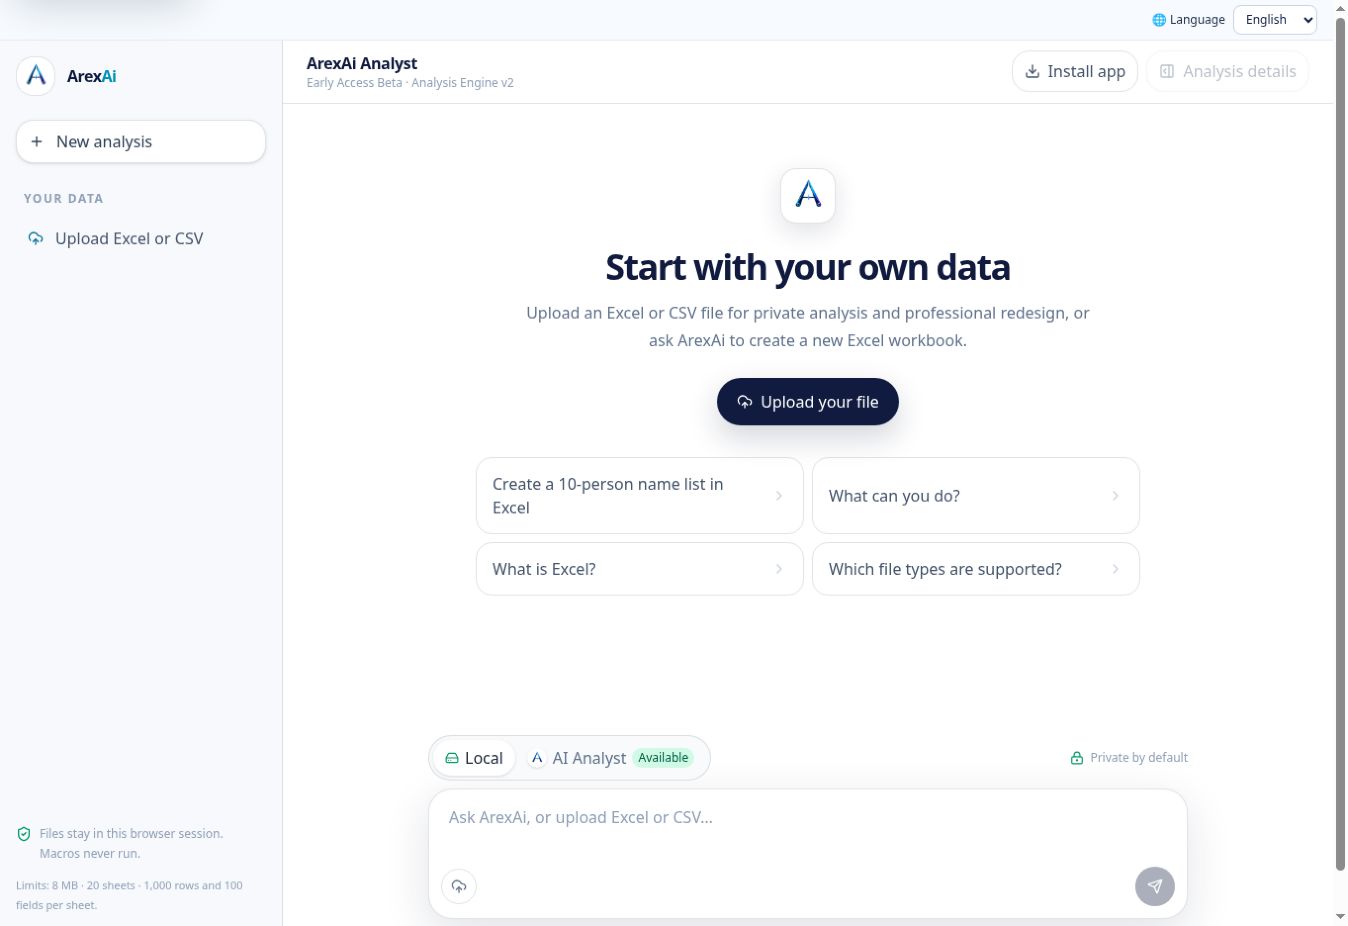
Upload XLSX, XLSM or CSV and inspect sheet structure, field types, missing values, duplicates and ranges.
Request KPIs, trends, anomalies or cross-sheet comparisons in plain language.
Use calculation-first analysis so numeric claims are checked against workbook-derived context before explanation.
Approve a workbook plan before ArexAi creates or redesigns an .xlsx output and verifies its integrity.
Current beta limits
8 MB maximum file size
Up to 20 sheets per workbook
Up to 1,000 sampled rows per sheet
Up to 100 detected fields
Privacy boundary
Raw workbook rows remain browser-local. AI requests use minimized structural or statistical context. Users should still remove secrets and unnecessary personal data before any analysis.
Read the complete privacy policy